Three Findings Paint A Worrying Picture Of Emissions Intensity Reporting
Emissions intensity measurements are meant to provide a way for firms to compete, and win, business or investment because they’ve found a way to make products in a way that has less of a climate impact. But the vagaries of reporting may mean that reported emissions intensity are actually misleading.
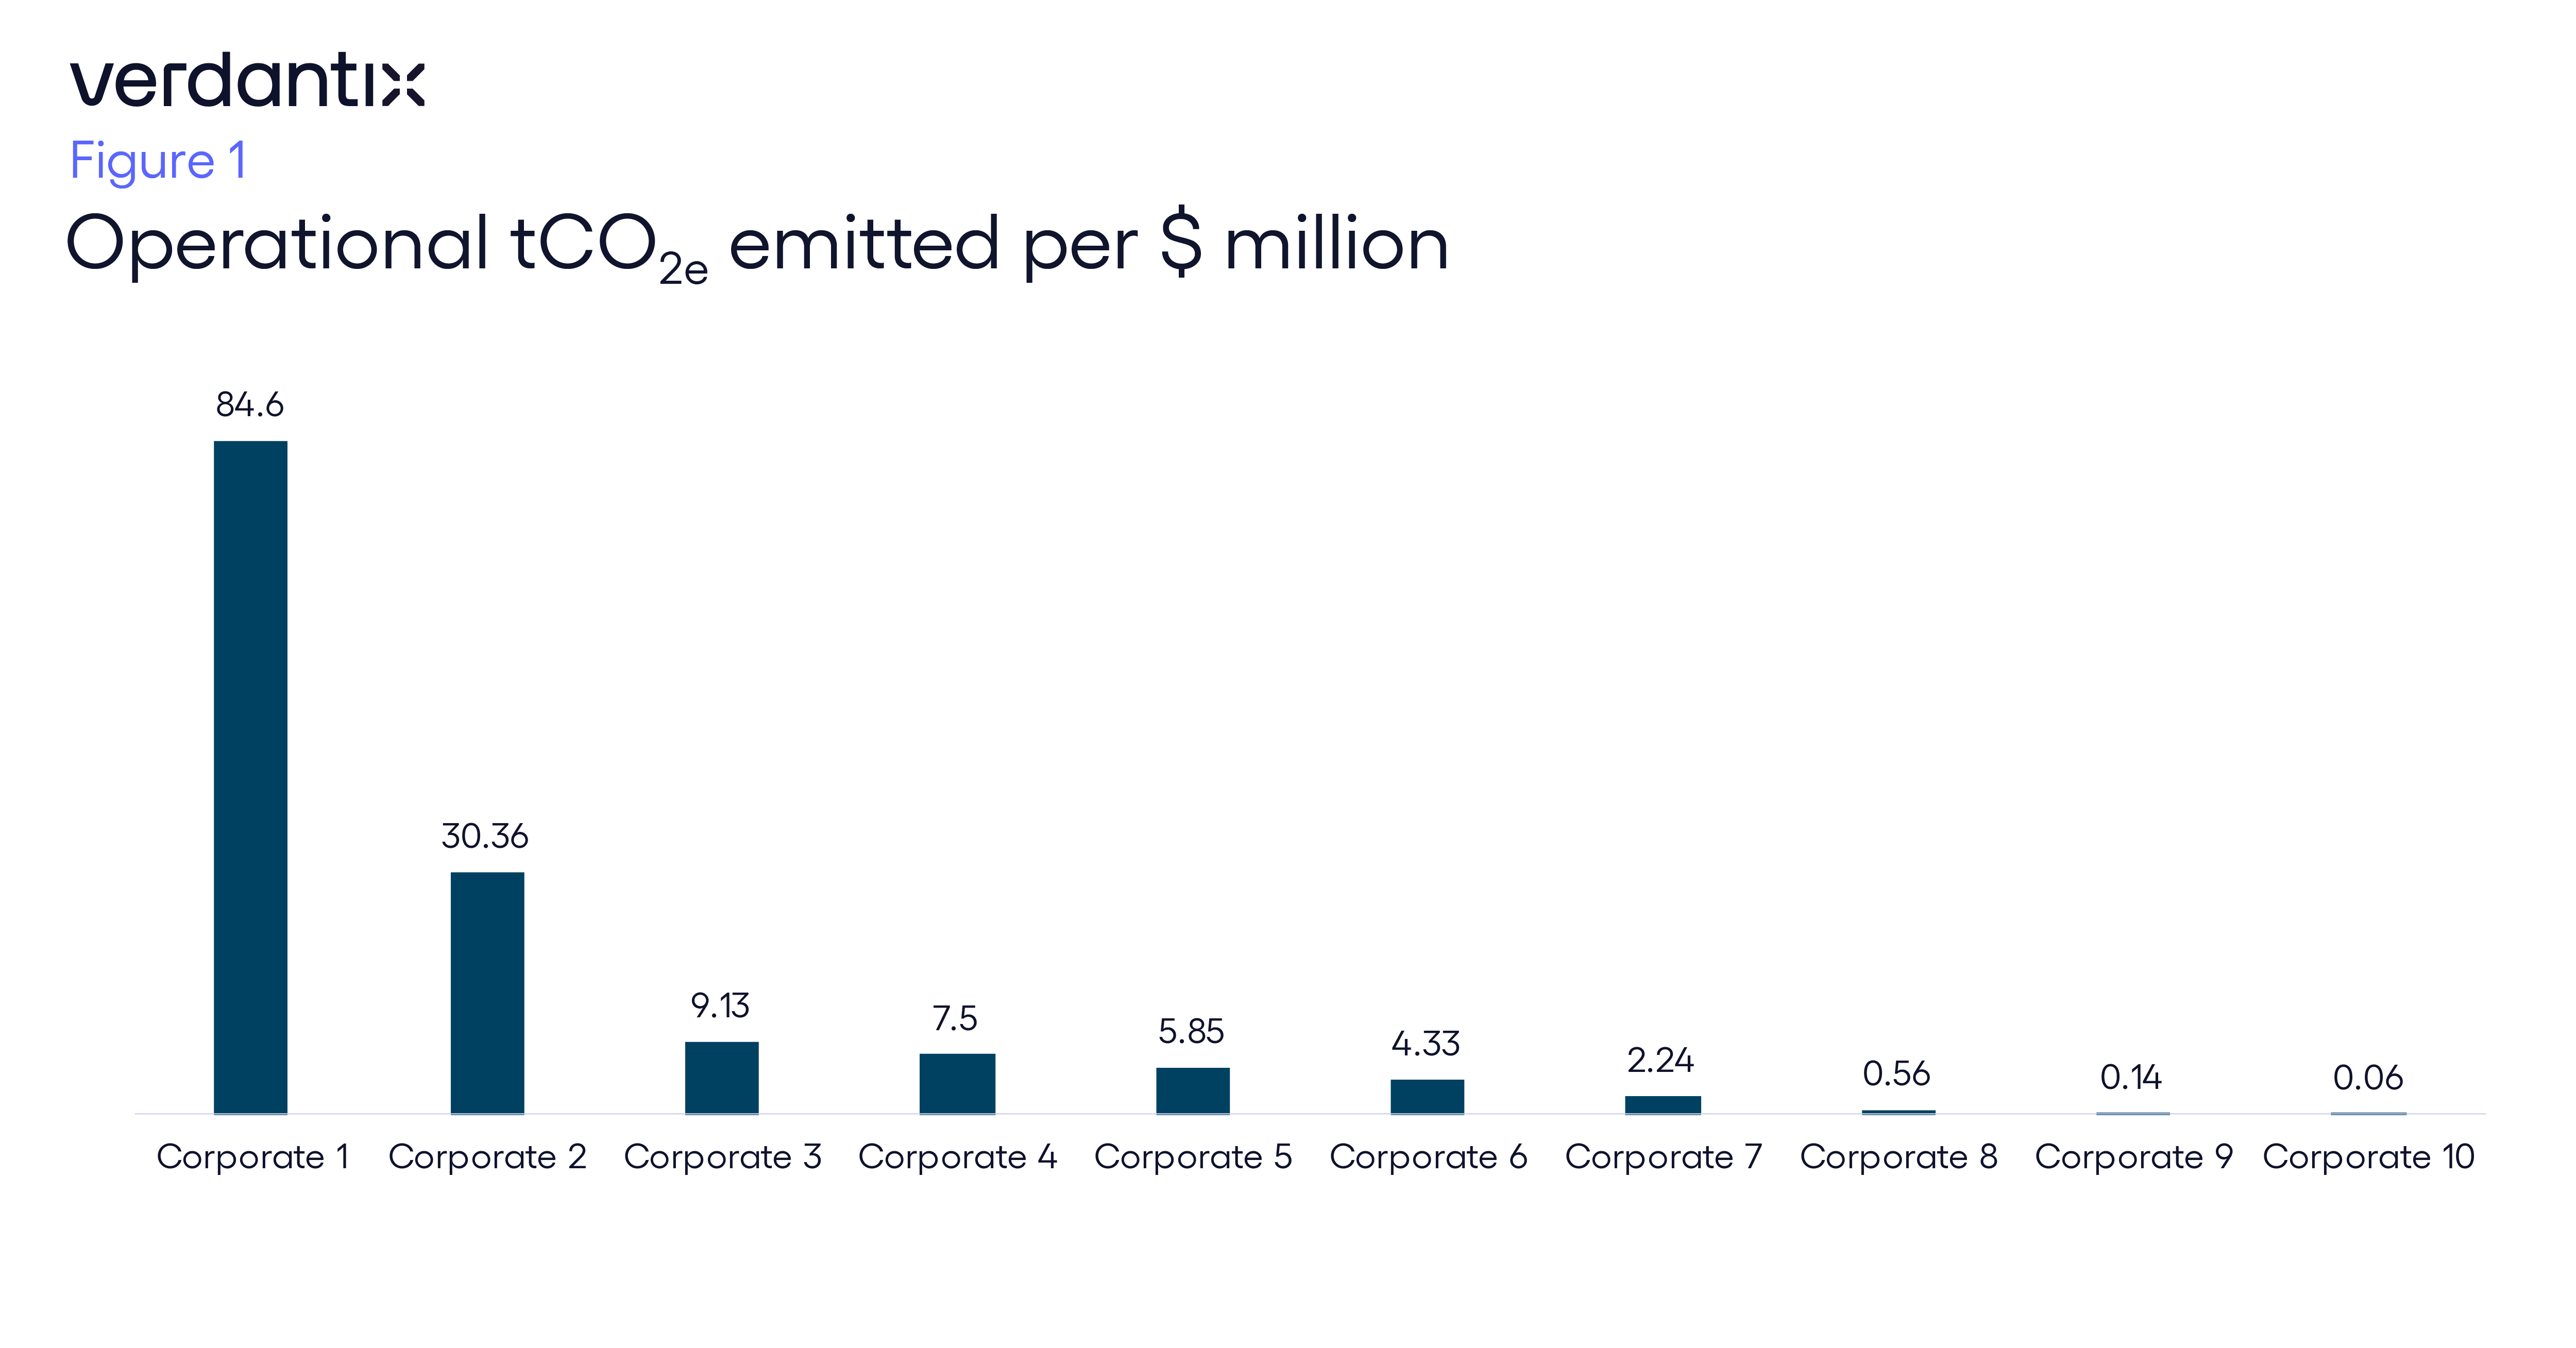
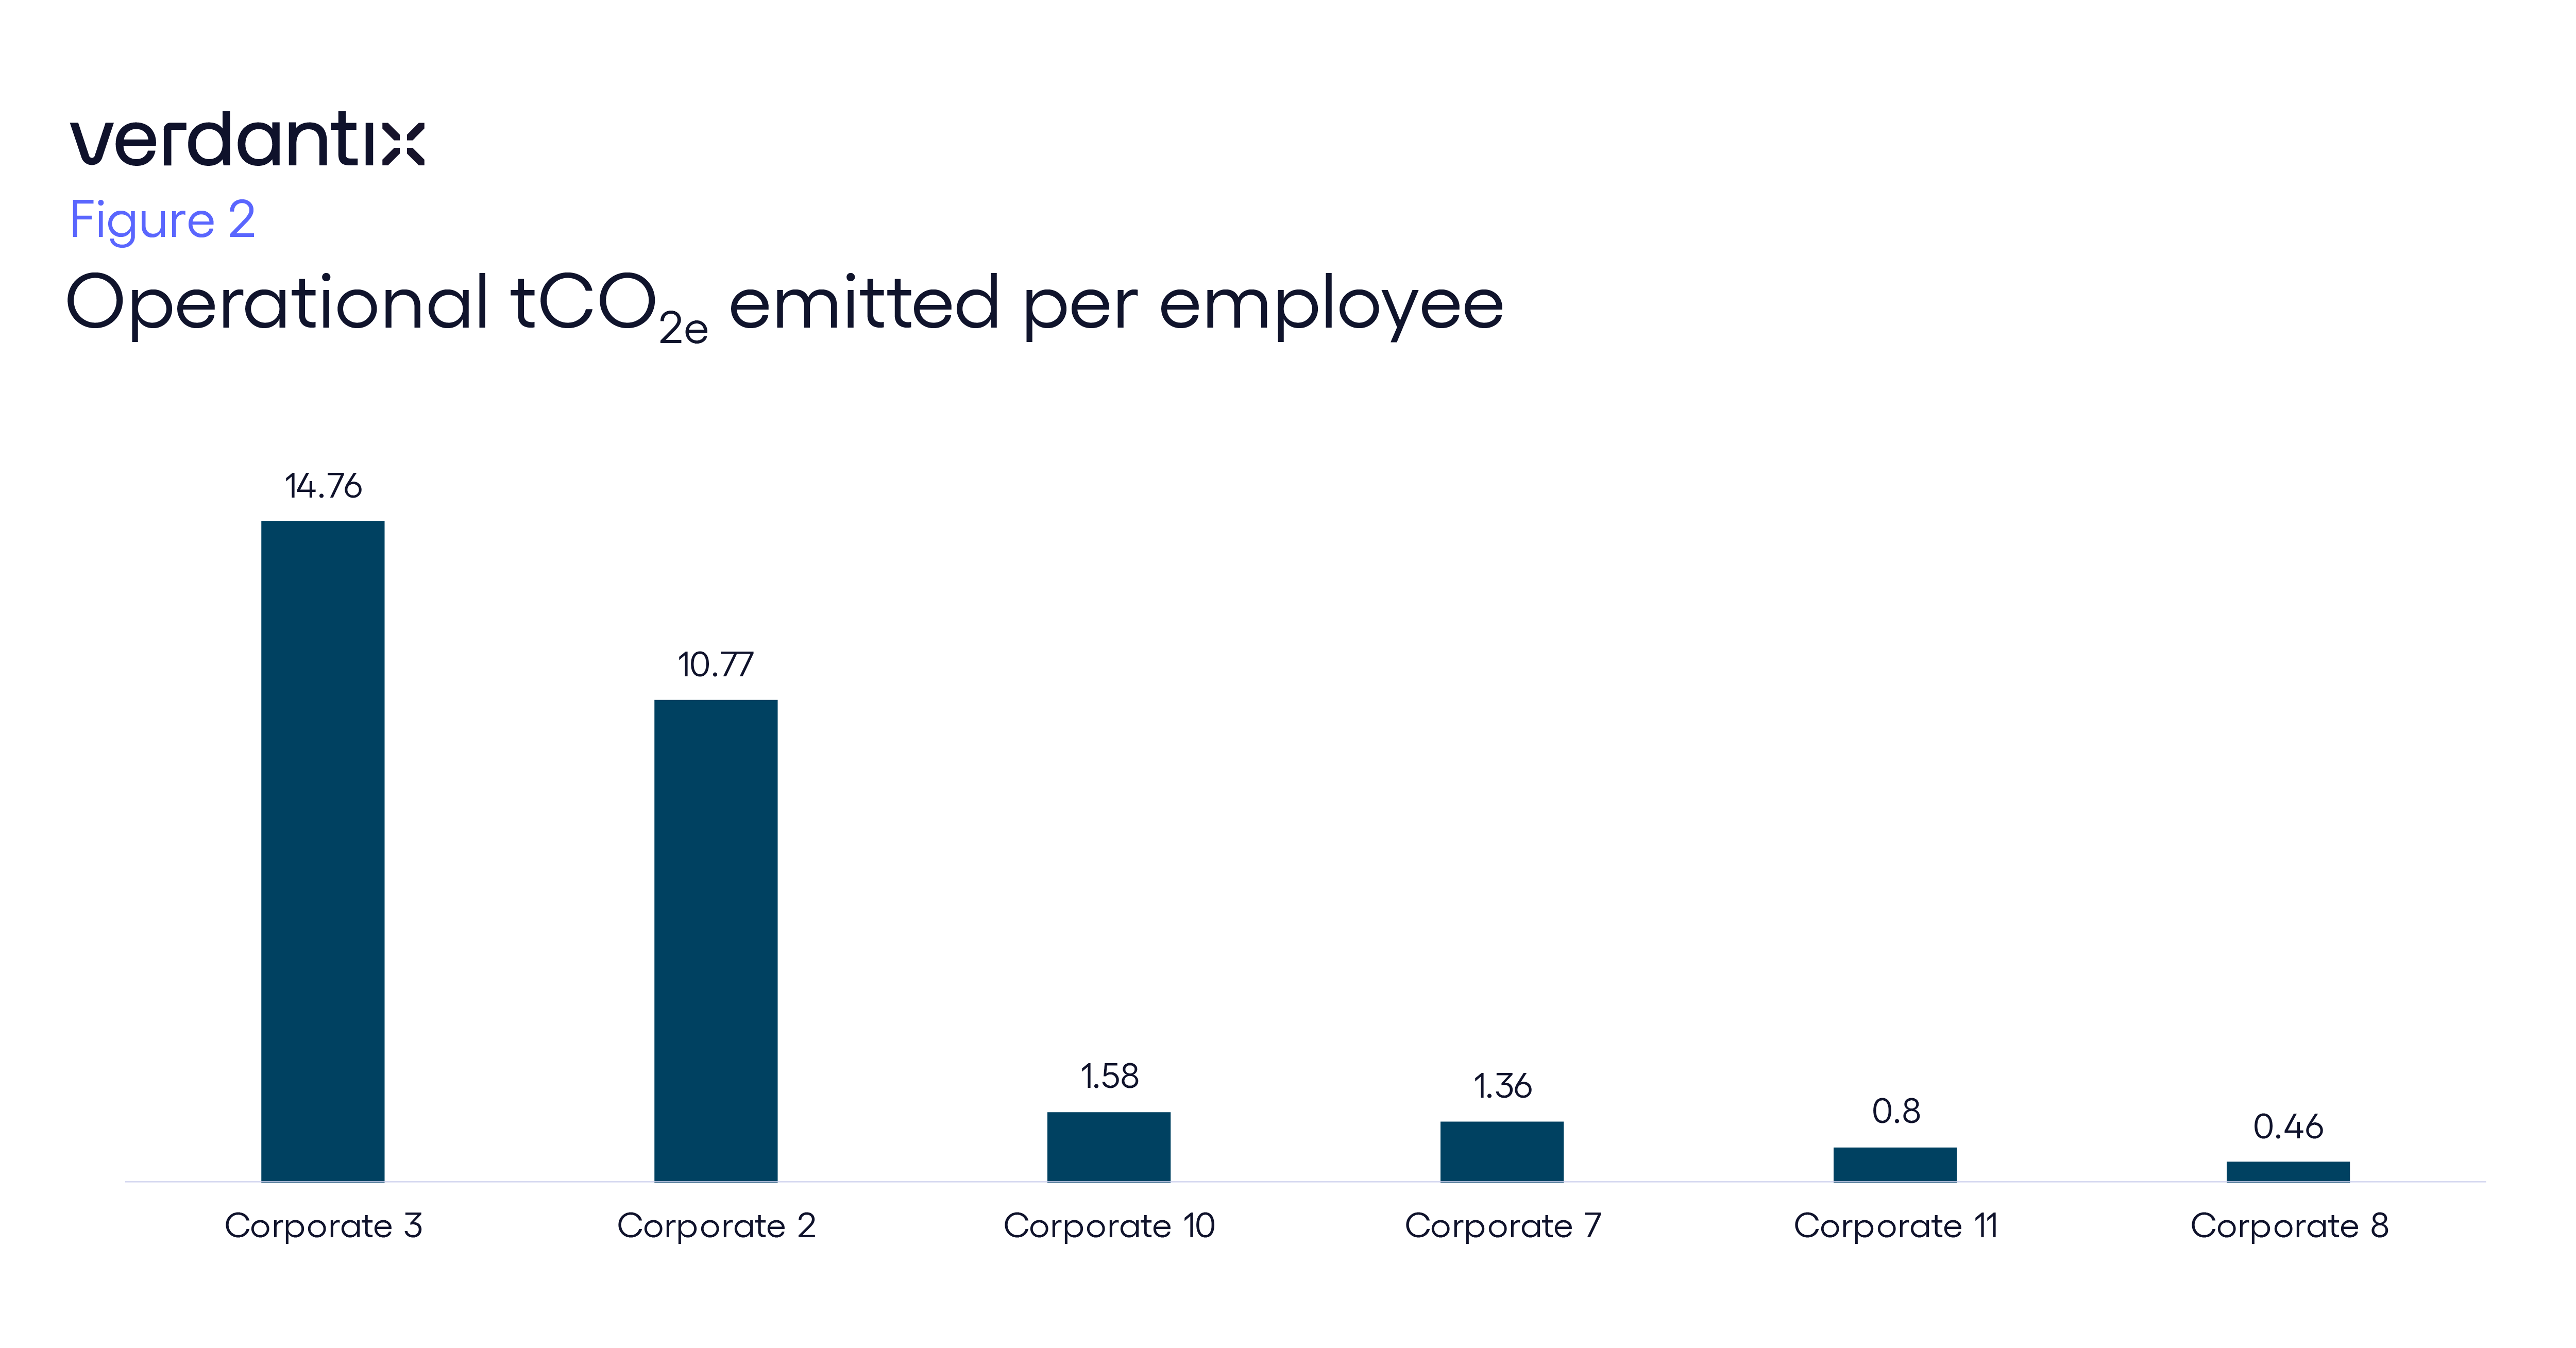
We used the Verdantix Climate Benchmark to compare the emissions intensities of 11 of the largest software firms in the world. Of the 10 that disclosed emissions per unit revenue, half reported between 2 and 10 tCO2e per million dollars. Three reported less than 1 tCO2e per million dollars. At the other extreme, one firm reported over 80 tCO2e per million dollars (see Figure 1). Six corporates disclosed emissions per employee, with four reporting less than 1 tCO2e per employee. The remaining two reported between 10 and 15 tCO2e per employee (see Figure 2).


From these data, several key insights emerge:
- Emissions intensity is related to completeness of Scope 1 and 2 GHG emissions disclosures. Corporates 2 and 3 had the most complete Scope 1 and 2 disclosures, both with scores over 70%. Corporate 1 was tied for third place with a score of 68%. Corporate 1 also had the most complete disclosures overall and the most complete Scope 3 disclosures. Thus, it is critical to understand what is included in the emissions calculations to meaningfully compare intensities across firms.
- There’s a very large range of emissions intensities reported. Considering emissions per unit revenue, the highest intensity is more than 100 times the lowest. The difference is less pronounced for emissions per employee, but still spans more than one order of magnitude. While some of this may be due to the completeness of the disclosures, as mentioned above, there could also be opportunities for high emitters to adopt strategies from their peers to reduce the intensity of emissions.
- Rankings are different when considering emissions per unit revenue and emissions per employee. For example, emissions per million dollars are approximately three times larger for Corporate 2 than Corporate 3, but when looking at emissions per employee, emissions of Corporate 3 are about 50% larger than those of Corporate 2. Similarly, Corporate 10 has the third highest emissions per employee but has, by far, the smallest emissions per unit revenue. Only five of the software firms reported both intensities, but neither metric provides a complete picture of which organizations perform best regarding emissions intensity. Without comprehensive disclosures, corporates may be able to pick and choose the metrics that improve their image.
As with any analysis, the quality and consistency of the data is key. Here, we have evidence that the completeness of climate risk disclosures can affect and distort conclusions. Fundamentally, investors and analysts cannot compare firms’ climate performance without first benchmarking and validating the disclosures themselves, as variability in how disclosures are calculated throws off results.
Challenges in comparability are proving endemic to climate data. Like our analysis, a study by the University of Oxford’s Sustainable Finance Group found that heterogeneous carbon accounting data was throwing off financial firms’ emissions estimates.
The big takeaway here is that climate leaders and investors need to build up their climate data validation capabilities in order to move from apples-to-oranges comparisons to apples-to-apples.
About The Author

Emma Cutler
Principal Analyst


