Generative AI With Knowledge Graphs: A Giant Leap For Industrial Data Management

Joe Lamming
Spreadsheets have been the go-to enterprise tool for entering, managing, analysing and storing small-scale structured data – rows and columns – for decades. For unstructured data – documents and presentations – the portable document format (PDF) dominates, growing from an Adobe specification in 1993 to an ISO standard in 2008.
Spreadsheets and PDFs have been, and remain to this day, the interoperable information transmission norm for enterprise and industrial firms. While SaaS solutions can elegantly render information on webpages with backend interoperability handled silently by APIs, as soon as a frontend user wants to move data to another app, they’ll see a batch.xlsx (or .csv) or report.pdf show up in their Downloads folder. On a larger scale, these unstructured data are stored in document-oriented databases, productized within enterprise document management solutions like Microsoft’s SharePoint, Dropbox and OpenText’s Documentum.
Why does this matter? Because spreadsheets and PDFs create data siloes. While an Excel spreadsheet stores data in rows and columns, it might also contain notes, images, charts and macros. This is arguably no less unstructured than a PDF document – and unstructured data are, by definition, impossible to analyse directly without interpretation or transformation. Analytics solutions for monitoring trends or anomalies require apples-to-apples, assets-to-assets, temperatures-to-temperatures comparisons – and unstructured data might bury such comparisons within a chart, an image, a note or a separate table.
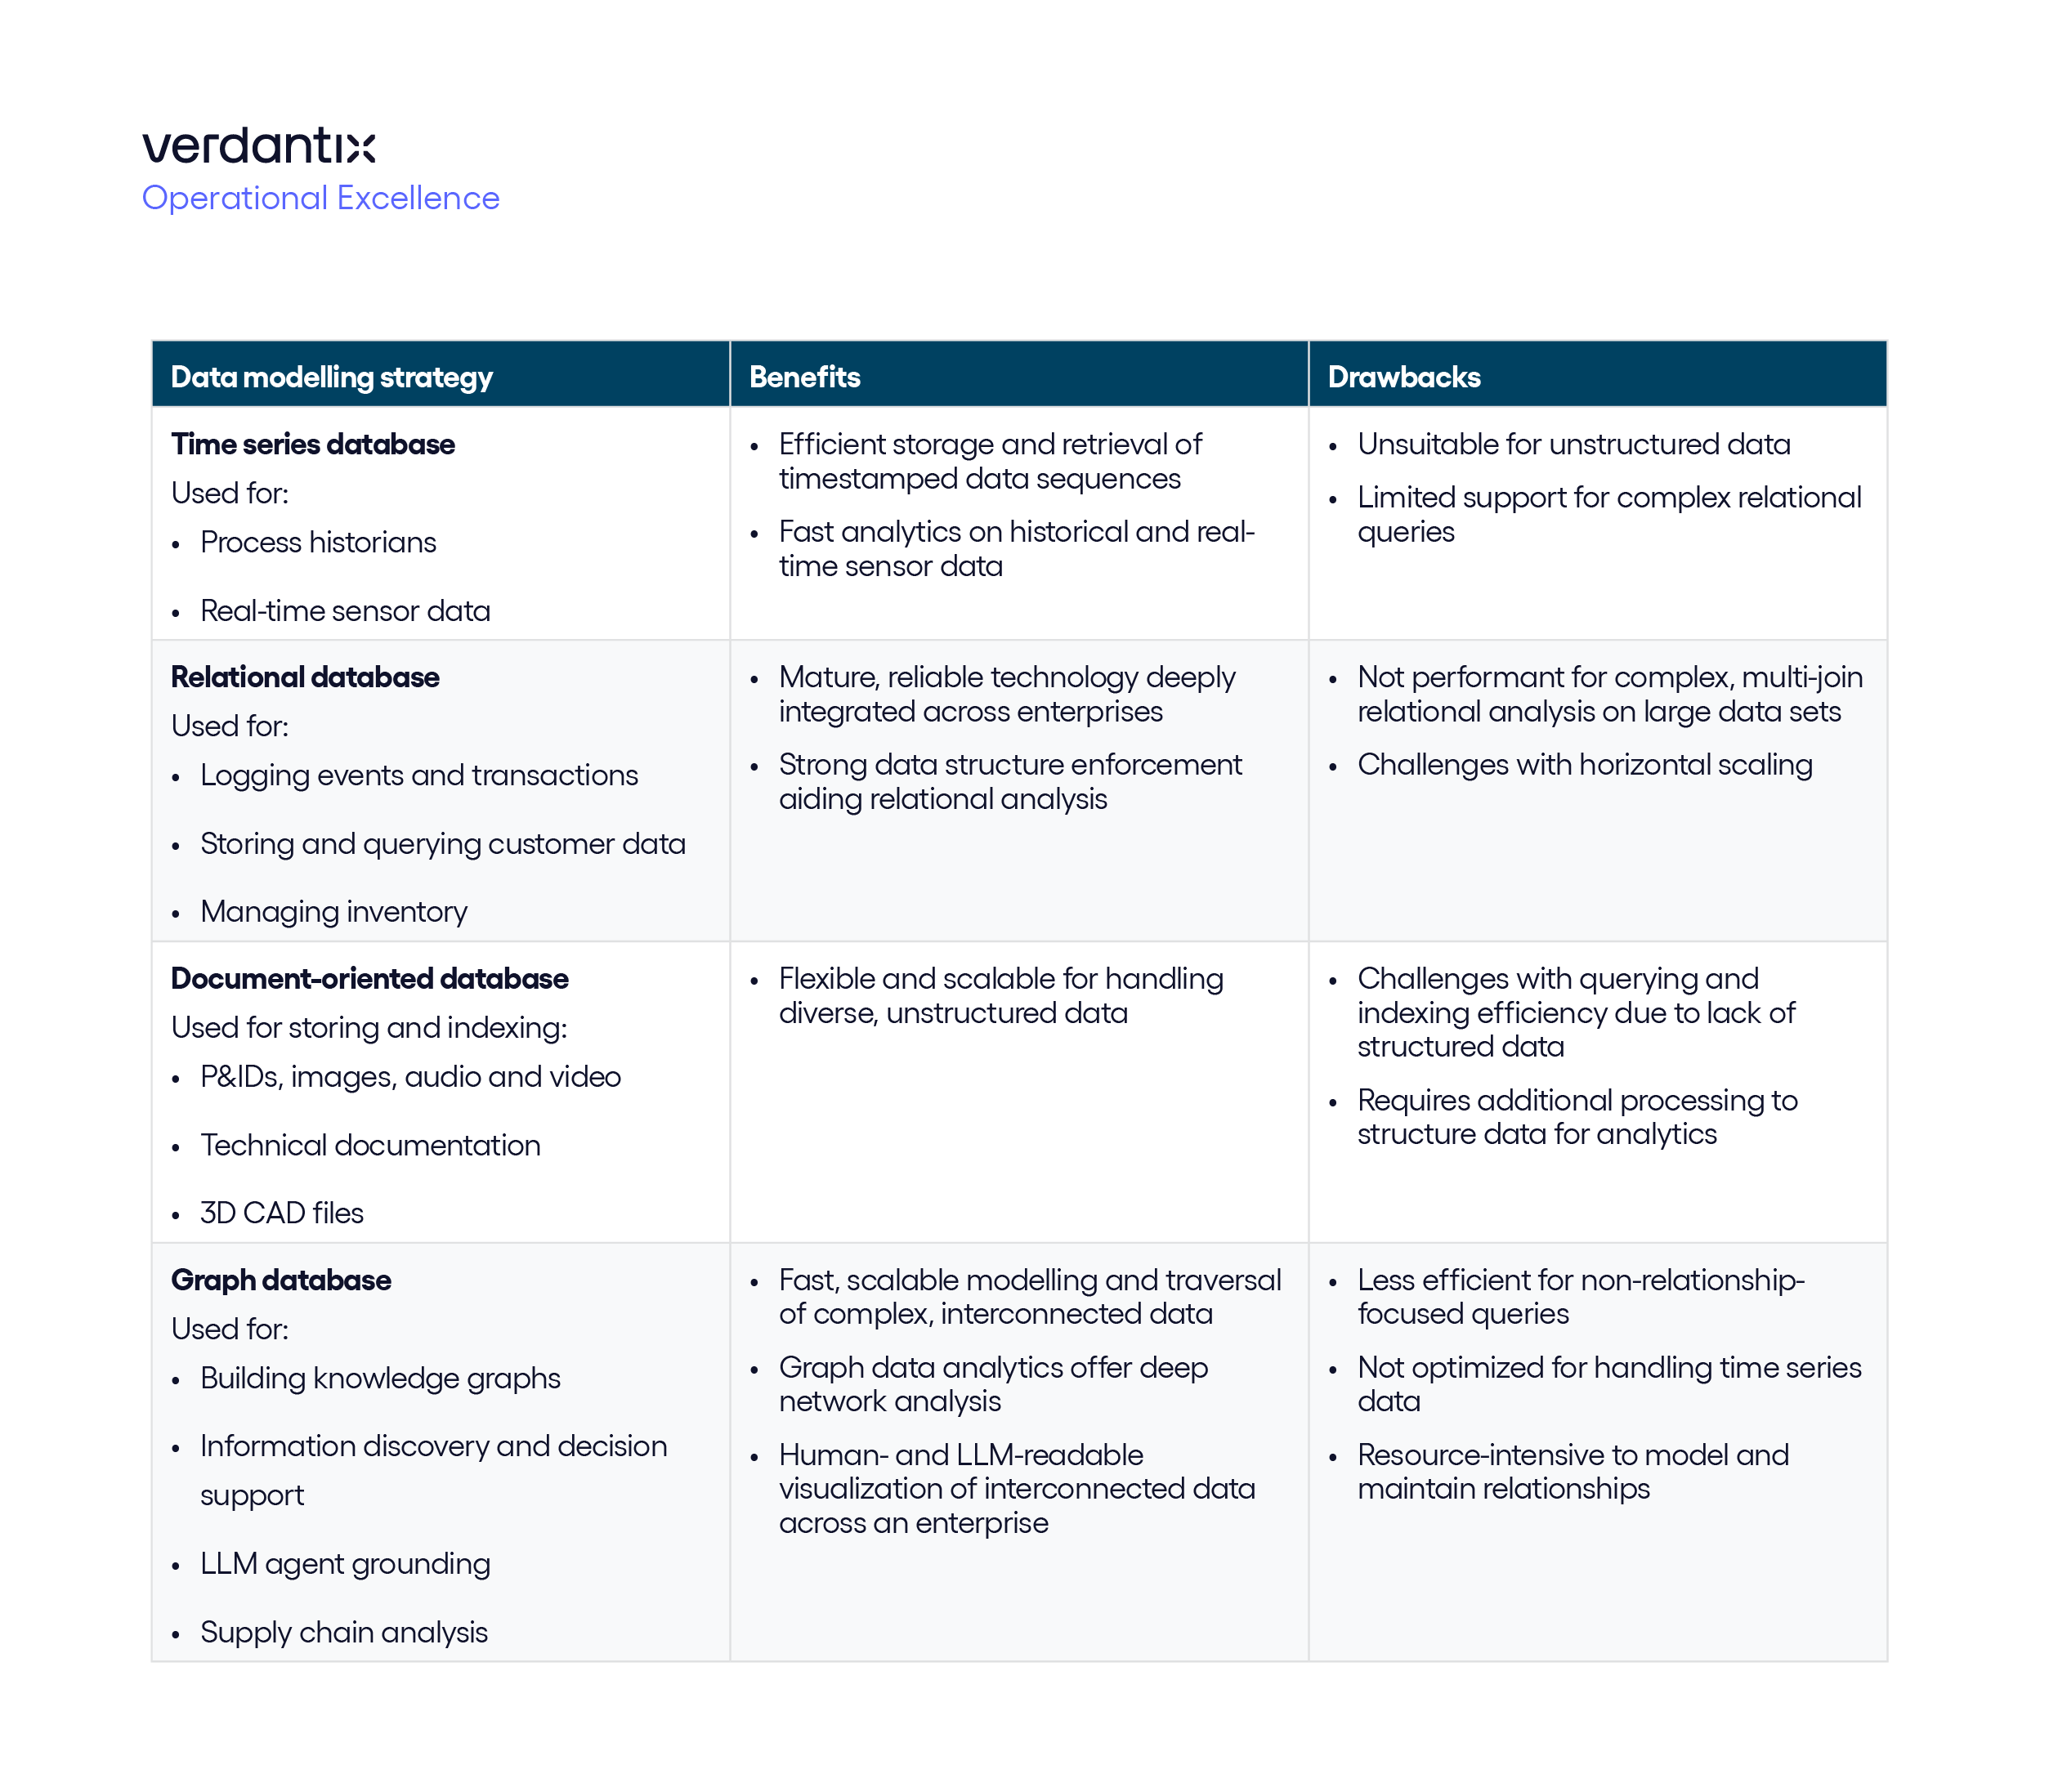
One approach is to structure the unstructured. Extract information from every spreadsheet and PDF to build an enterprise-scale database of cross-referenced tables – a ‘relational database’. Such approaches are the basis of task-specific software such as ERP, EAM and CRM, offering users dashboards for inventory, productivity, energy efficiency and even near-miss safety incidents. Time series databases excel at querying high-frequency sensor readings sorted chronologically. The difficulty of scaling this approach is, of course, related to data entry. Automated scraping of unstructured data is an unsolved problem – even domain experts sometimes struggle to interpret their colleagues’ work. Converting raw data into rows and columns also requires decisions on field (column) names – offering efficiency for certain analyses, but inflexibility in others.
For example, a process manufacturing facility manager receives a templated spreadsheet every day describing output from each production line, such as batch names, quality, input material suppliers, operator names and downtime – and uploads this to the ERP system. Two years later, this facility manager is trying to understand causes for a reduction in batch quality. Navigating multiple tables, joins and filters, the analysis is cumbersome, taking weeks to pinpoint issues with specific suppliers and machine downtimes. Semantic relationships between assets, workers, suppliers and processes are not explicit, and must be inferred during the analysis.
Enter the graph database. Instead of rows and columns, graph databases represent information as nodes, semantic connections and properties. Such approaches map the interconnectivity of data, rather than just the discrete data points themselves. Switching to a graph database visualizer – offered by vendors such as Neo4j with its Bloom visualizer, alongside industrial data management providers such as Cognite, C3 AI, Palantir and SymphonyAI Industrial – the facility manager can explore the interconnected data visually, where batches, suppliers, machines and operators are represented in their dynamic context, offering a 360 degree view into more than just data. Such a database delivers real information, knowledge: hence the term ‘knowledge graph’.
Converting relational data to a knowledge graph is straightforward if tables are extensively cross-referenced. Clear benefits, however, stem from extracting semantic information from unstructured data directly.
Enter the large language model (LLM). OpenAI’s breakthrough in 2020 with its GPT-3 LLM presented a compelling demonstration of automated systems understanding natural language. Fast forward to April 2024 and a diverse set of providers beyond OpenAI – from Anthropic to Alibaba to Cohere to Google DeepMind to Meta to Mistral – offer fast, vastly capable API-accessible and even some open-source models that rapidly ingest, understand and diligently structure data. The application? Structuring the unstructured. Extracting named entities, their relationships, their properties – and recording them in a knowledge graph.
While efficiently feeding multimodal data to LLMs is an unsolved problem – and even today’s most powerful models are still prone to mistakes – software providers’ increasingly successful efforts in building application-focused data extractors and guardrails around LLMs mean data management for industrial facilities, and enterprises, is about to take another giant leap.
To read more, check out the Verdantix Buyer’s Guide on industrial data management solutions and market overview on applications of large language models for industry.

About The Author

Joe Lamming
Senior Analyst


